
Figure 4.
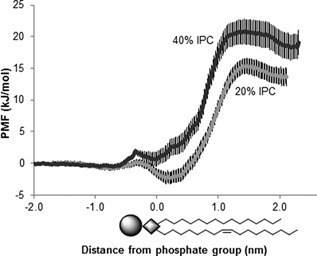
In silico simulations of membrane permeability to acetic acid with 20% and 40% sphingolipids. The graphs show the potential of mean force (PMF) of transferring the acetic acid over the membrane. Each trace represents the mean of 20 blocks from two simulations and two independent positions of the acetic acid molecules. The error bars indicate the standard deviation. Schematic drawing of POPI represents the lipid bilayer.