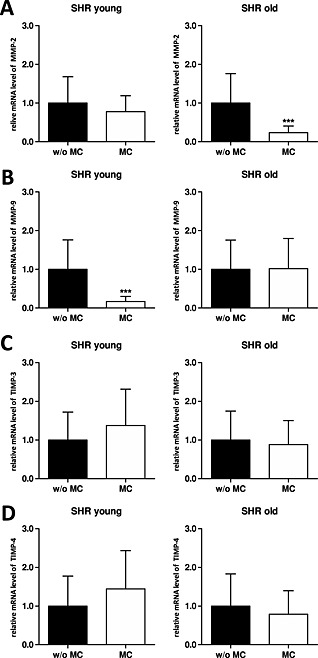
Figure 3.

In vivo mRNA expression data from young and old spontaneous hypertensive rats without and with microcurrent treatment. Graphs showing transcript changes using qPCR analysis as fold change relative to glyceraldehyde‐3‐phosphate dehydrogenase. (A) Matrix metalloproteinase (MMP)‐2; (B) MMP‐9; (C) tissue inhibitor of metalloproteinase (TIMP)‐3 and (D) TIMP‐4. In all cases, data shown are the mean ± standard deviation of five animals per group, *P < 0.05; ***P < 0.001.
