
Figure 4.
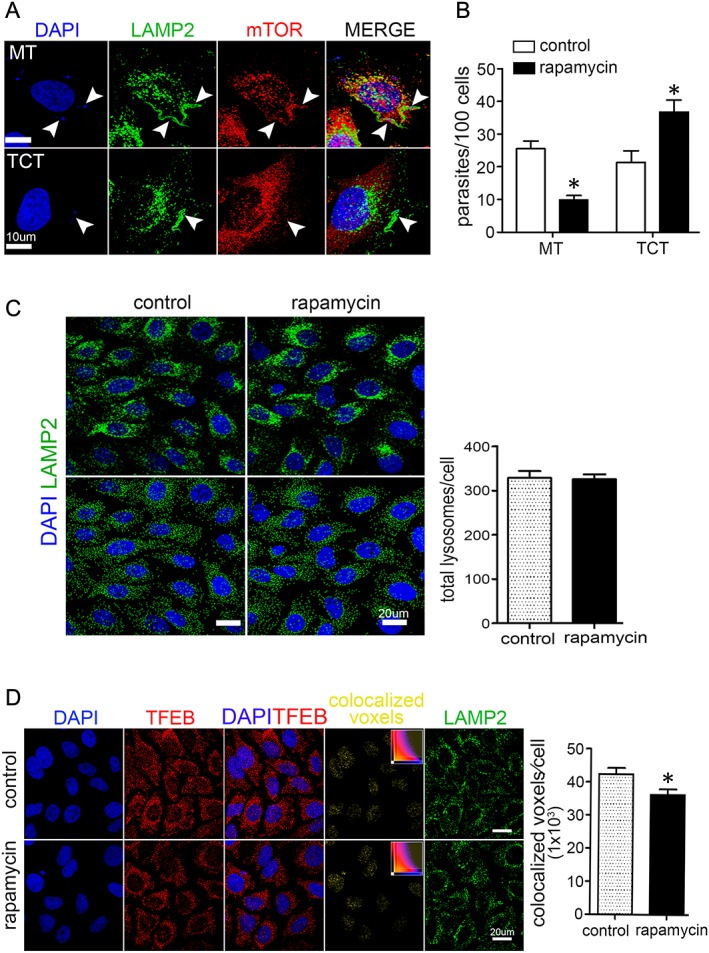
Inhibition of mTORC1 by rapamycin decreases T. cruzi MT invasion and stimulates TCT entry into host cells. A. HeLa cells were incubated for 30 min with MT or TCT and processed for immunofluorescence analysis, to check their association with LAMP2 (green) and/or mTOR (red). Scale bar = 10 µm. Parasites are indicated by arrowheads. MT surrounded by LAMP2, and mTOR were visualized at the periphery of cells with scattered lysosomes, whereas a few TCT were LAMP2‐positive but negative for mTOR. B. HeLa cells were treated for 30 min with 100 nM rapamycin. After removal of the drug, the cells were incubated for 1 h with MT or TCT, and the number of intracellular parasites was counted. Values correspond to means ± SD of four independent assays performed in duplicate. Rapamycin significantly inhibited MT invasion (*P < 0.005) and stimulated TCT internalization (*P < 0.05). C. Rapamycin‐treated and untreated cells were processed for immunofluorescence to quantify lysosomes (60× objective). Note in the upper panel the rapamycin‐induced perinuclear accumulation of lysosomes. Quantification of lysosomes using the 3D construction of confocal images (lower panel) did not reveal any difference in lysosome numbers in rapamycin‐treated cells as compared with untreated controls. D. Rapamycin‐treated and untreated Hela cells were processed for confocal immunofluorescence for detection of lysosomes (green), TFEB (red) and nucleus (blue). Colocalized DAPI/TFEB voxels were quantified using Imaris software. Values in the bar graph are the means ± SD of six microscopic fields (≥ 150 cells). There was a small, but significant, difference between rapamycin‐treated and untreated cells (*P < 0.05). Scale bar = 20 µm.