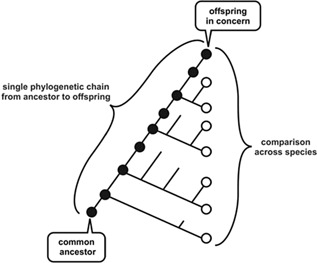
Figure 1.

Schematic representation of single‐chain phylogeny and comparison across species in phylogenic tree. Schematic representation of the comparisons along single‐chain phylogeny and across species. In the phylogenic tree shown here, the currently existing species represented by the right‐end circles, are diverted from a common ancestor. Branching from a common ancestor leads to establishment of some new species, while some are terminated by extinction. The comparison of developmental processes across species is made over the existing species. On the other hand, a single phylogenic chain, which we focused in this study, is given as the line from the common ancestor to the offspring in concern. From the species in concern, ancestors are uniquely traced back. The comparison of developmental processes along this chain is possible at least in theory or simulations, which provides fundamental information on possible relationship between development and evolution.
