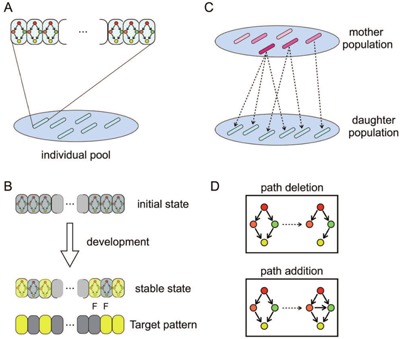
Figure 2.

Schematic representation of simulation procedure. (A) There are 100 individuals in a pool for each generation. Each individual consists of 96 uniform cells, which share a common GRN, while the GRN differs slightly between individuals. (B): Each individual develops from the same initial state in which genes are not expressed (i.e., with x < 0) except for genes receiving the maternal gradient. Over time, individuals develop into stable states. Colors of cells indicate the expression level of the output genes; yellow is high, gray is low. After reaching a stable state, the expression pattern of the output gene was compared with the predefined target pattern. The fitness level was then elevated as the stable expression of the output gene approached the target pattern (see the Methods section for detail). (C) After the fitness of every individual was calculated, the population for the next generation was created. Each individual was selected as a mother with a probability proportional to its fitness. In the figure, the degree of red color indicates the fitness. (D) The GRN of a daughter is slightly different from the mother's, with a given mutation rate. The mutation involves deletion or addition of paths in the mother's GRN, and a change in characteristic parameters in expression dynamics and the diffusion constant (see the Methods section for details).
