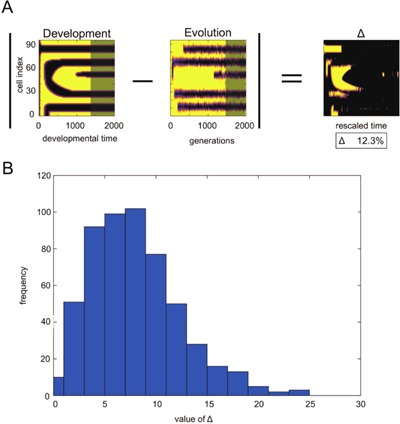
Figure 5.

Quantitative analysis of the degree of evo‐devo congruence. (A) Schematic diagram illustrating quantitative analysis of the similarity between evolution and development. The differences between development and evolution were computed by subtracting expression levels at each pixel. By taking the absolute value of difference, and averaging the space‐time pixels, the average difference was computed. To avoid over‐estimating similarity, the region before the emergence of the first stripe and after the final pattern was ignored for both development and evolution. For example, the gray‐masked region of the development and evolution figures does not include data for the calculation. If one stripe is completely shifted in time, is approximately 8%. (B) Histogram of the distribution of the Δ values. The abscissa is the Δ value computed via the procedure described in (A). The ordinate is the frequency of touch Δ values determined by bin size 2. Distribution was obtained from 500 runs with different target patterns.
