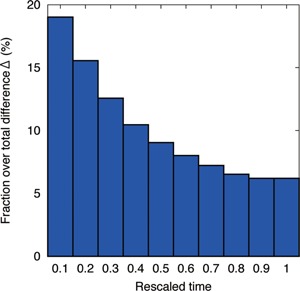
Figure 6.

Time distribution of the difference Δ between evolution and development. We computed the difference Δ in space‐time pixel. Then we obtained the distribution of Δ over all simulation results, by using the histogram with the time bin of 1/10 of rescaled time between 0 (initial) and 1 (final). Difference in evolution and development is more frequent at earlier stages.
