Figure 9.

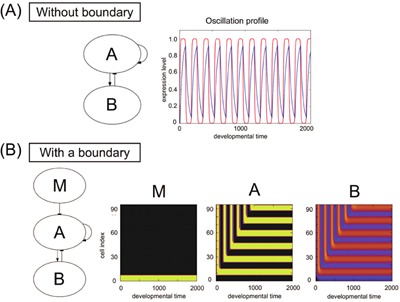
Feedback oscillation and its fixation. (A) Without boundary: minimal network for oscillatory expression with the time series of the expression for a specific cell. Gene A activates the expression of gene B and itself, and gene B suppresses A. In the plotted time series, developmental time is plotted as the abscissa, and the expression levels of A (red) and B (blue) are plotted as the ordinate. (B) With a boundary: the input from gene M, which was influenced by the maternal factor, was included in the oscillatory network. The space‐time diagram of genes M, A, and B illustrate how oscillatory expressions of gene A and gene B were fixed to form stripes. Gene M was expressed near the boundary.
