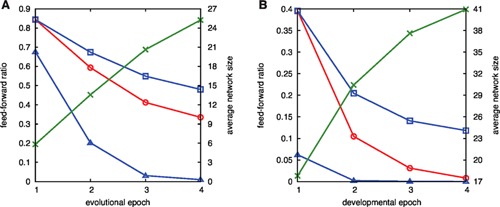
Figure 11.

Feedforward ratio. (A) The red circle denotes the fraction of working networks that do not include a feedback loop, plotted as a function of evolutional epoch. The fraction is computed from 500 samples of evolution simulations. For reference, the probability estimated from the value at the first epoch only as a result of the increase in the network size is plotted as the blue square, while the blue triangle denoted such probability computed from 2 × 10⁶ random networks of the corresponding size, generated only under the constraint that there are paths from the morphogens, and to the target. The average size of the network computed from the simulation is also plotted as green cross with the second vertical axis. (B) Ratio of the feedforward network as a function of each developmental epoch, computed in the same manner as (A) and plotted with the same use of symbols. Here both for evolution and development, the target pattern is mostly reached with four or less bifurcations so that we plot the case up to 4 epochs.
