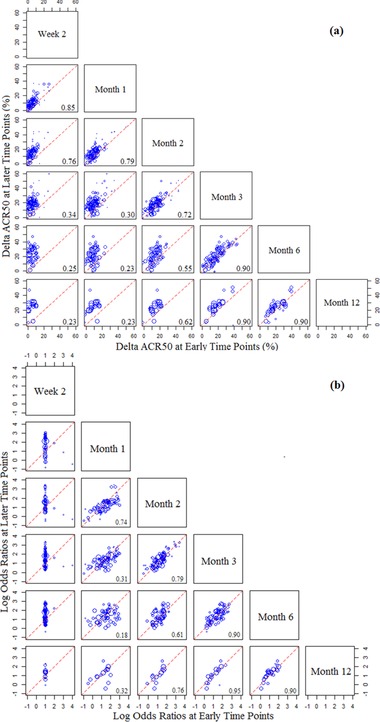
Figure 1.

Pairwise correlations of the treatment effects (ACR50) between early and late time points. The treatment effect for each treated arm is expressed either in linear format (ΔACR50, panel A) or in log OR format (odds ratio of treated vs control; panel B). In each scatter plot the symbols represent the treatment effect at a later time point (specified at the right end of each row) vs that at an early time point (specified at the top of each column). Symbol size reflects the sample size for each treatment arm. The value of R2 for paired values is indicated at the right bottom corner. Unity (dashed) lines represent equal efficacies of the early and late time points, whereas points above the lines suggest higher efficacies at the late time point, and points below the lines suggest higher efficacies at the early time point.
