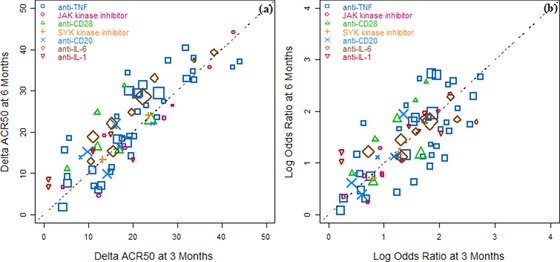
Figure 2.

Strong correlations were observed between the treatment effects at 3 months and 6 months. (a) Scatter plot of the linear form of treatment effect, ΔACR50, at 6 months vs 3 months. (b) Scatter plot of log odds ratios of treated vs control at 6 months vs 3 months. The symbols represent different drug classes. The symbol size reflects the sample size for each treatment arm. The unity line represents equal efficacies at the 2 time points. Both plots suggest a similar mean effect after 3 months and 6 months for the trials tested in the database. With this data set the scaling factor was estimated to be 0.997 (95%CI: 0.903, 1.09). ACR50, American College of Rheumatology score 50; CI, confidence interval.
