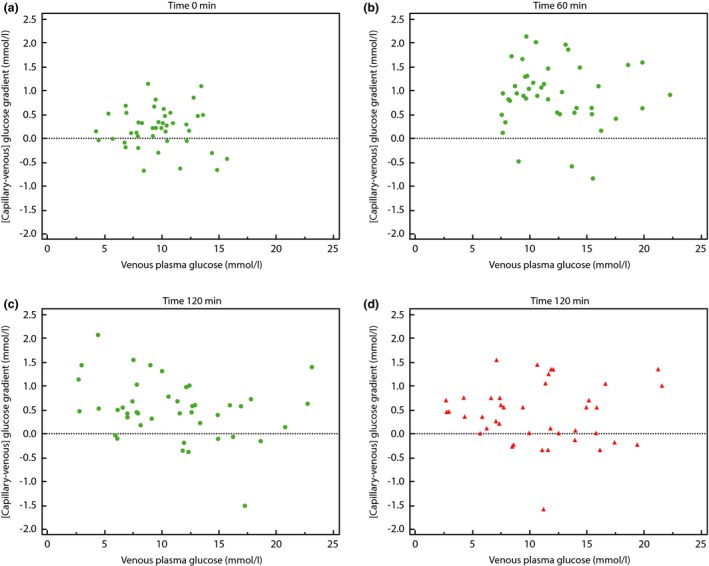
Figure 2.

Points represent results from individual participants. The x axis shows antecubital venous plasma glucose and the y axis shows the [capillary – venous] glucose gradient. The horizontal dashed line is for orientation; values above this line represent those results which show a higher capillary than venous glucose value. The glucose gradient is derived either from glucose meter measurements (Figs. 2 a–c, green), or derived from the laboratory measurement of plasma glucose (red). (a) Baseline (time 0 min) sampling point. (b) Time 60 min sampling point. (c) Time 120 min sampling point. (d) Time 120 min sampling point (plasma capillary samples).
