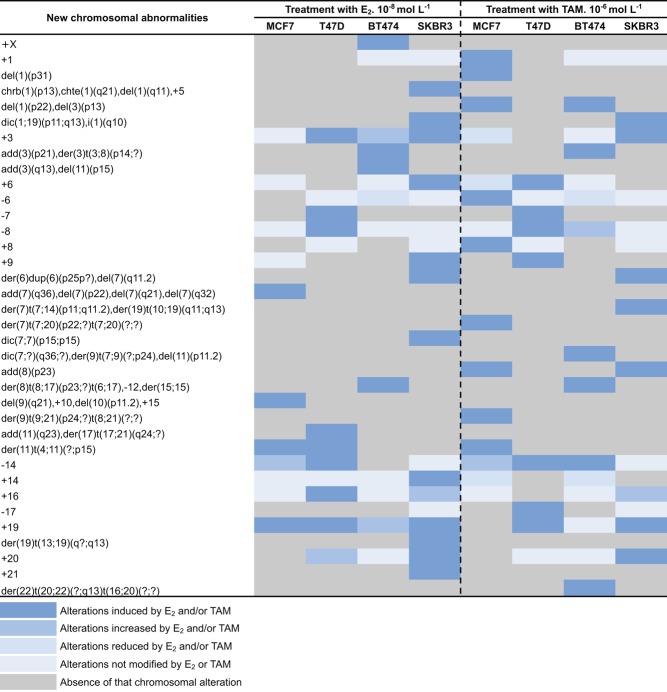
Figure 2.
Clonal chromosomal abnormalities induced by E2 and TAM in four breast cancer cell lines at each treatment time point. The presence of a given chromosomal alteration after E2 and/or TAM treatment in one or more cell lines is color coded according to the legend at the bottom. A full colour version of this figure is available at http://dx.doi.org/10.1530/ERC-16-0078.

 This work is licensed under a