
. 2016 Aug 1;23(8):635–650. doi: 10.1530/ERC-16-0078
 This work is licensed under a
 Figure 8.
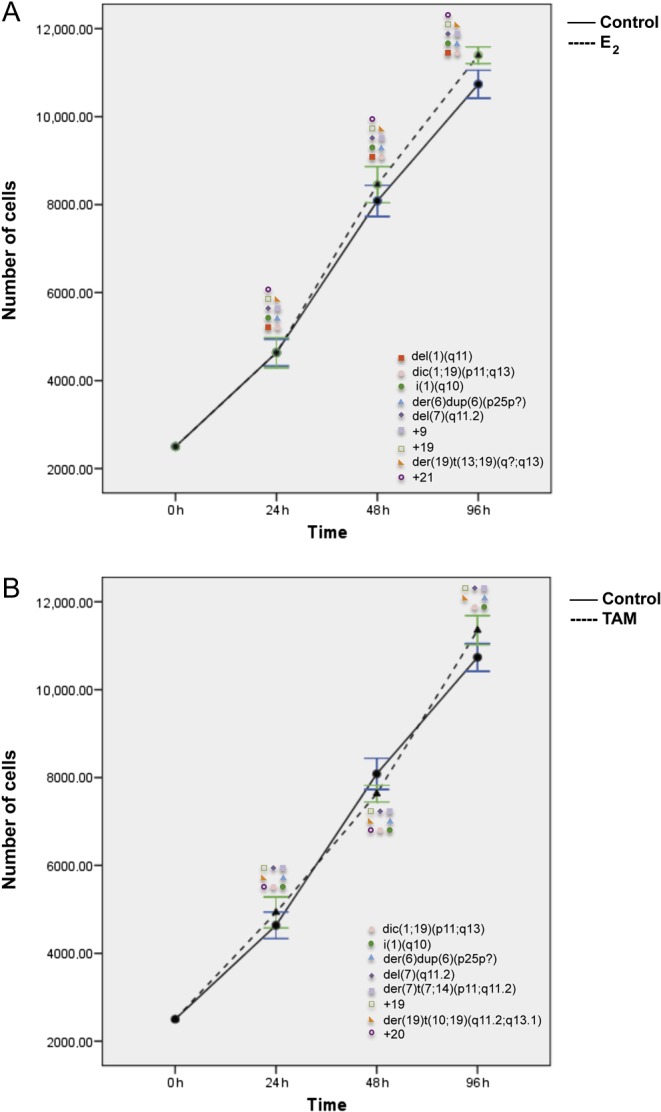
Effects of E2 (A) and TAM (B) treatment for 24, 48, and 96 h on proliferation and corresponding chromosomal alterations in SKBR3 cells. Error bars represent mean standard deviation of 24 separate experiments. Chromosomal abnormalities induced at each treatment time point are indicated. A full colour version of this figure is available at http://dx.doi.org/10.1530/ERC-16-0078.