Figure 1.
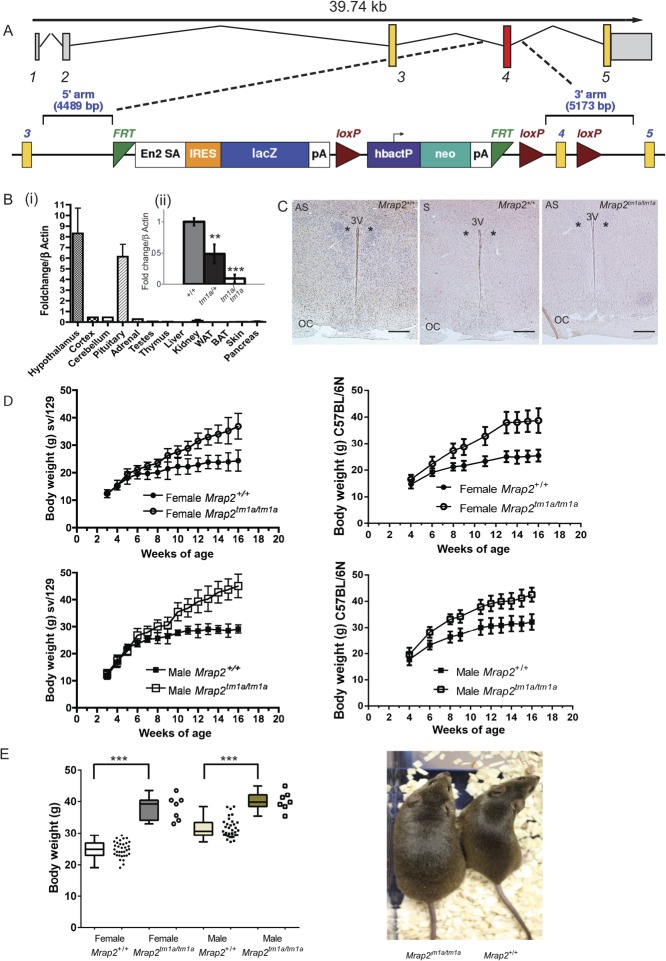
Mrap2 gene disruption results in weight gain (A) Schematic of knockout-first strategy for Mrap2. A promoter driven cassette including lacZ and neo genes are inserted upstream of critical exon 4. (B) Q-RT-PCR in 129/Sv mice demonstrating (i) Mrap2 expression in a range of wild-type mouse tissues showing the highest expression levels in the hypothalamus, n=3. (ii) reduced hypothalamic Mrap2 transcript in Mrap2tm1a/+and Mrap2tm1a/tm1a compared with Mrap2+/+ mice (n=3 per genotype); mean plotted ± s.e.m.; **P<0.005; ***P<0.0005). (C) Expression of Mrap2 in the hypothalamus of the wild-type 129/Sv Mrap2+/+ and Mrap2tm1a/tm1a mice as shown by in situ hybridization using coronal brain sections (approx. bregma – 0.6mm). AS, antisense probe, S, sense probe as a negative control. Third ventricle indicated as 3 V, asterisk indicates position of the PVN, OC, optic chiasm; scale bars=200μm. (D) Weight curves of Mrap2tm1a/tm1a in both genders and genetic backgrounds illustrated. 129/Sv Mrap2tm1a/tm1a n > 8 per genotype and gender, C57BL/6N Mrap2tm1a/tm1a n=7 of each gender and genotype. (E) Total body weight gain of C57BL/6N Mrap2tm1a/tm1a mice by the age of 16weeks, n=7 for each gender/genotype (left) and appearance of the mutant mice compared with the wild type (right). Data is presented as both box-and-whiskers plot (showing min-mean-max values, with the box representing the 25th and 75th percentiles), and as a scatter dot plot for individual values. P-values presented on graphs are either global P-values for genotype adjusted for multiple correction testing, or (in the cases of sexual dimorphism) the P-value is the impact of genotype for that sex.

 This work is licensed under a