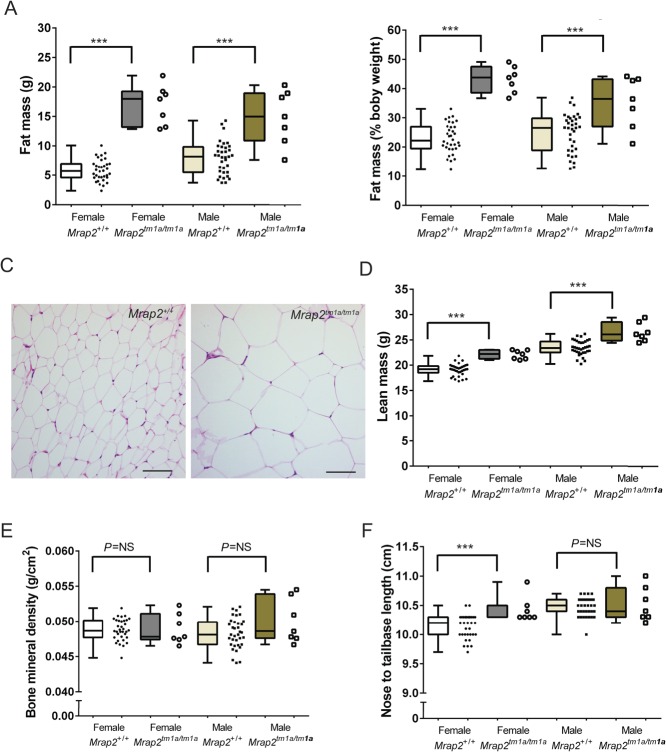
Figure 2.
Increased fat content and lean mass in Mrap2tm1a/tm1a mice at 14 weeks. (A) Increased fat mass in mutant C57BL/6N mice. (B) Fat mass represented as a percentage of body weight. (C) Adipocyte hypertrophy as demonstrated by H&E histology of peripheral fat (representative image of inguinal white fat from 129/Sv mice). Scale bars=200μm. (D) Increased lean mass and (E) no difference in bone mineral density or content (data not shown) in Mrap2tm1a/tm1a mice (C57BL/6N) compared with Mrap2+/+. (F) Increased body length in the female mutant mice only (C57BL/6N). n=7 for each Mrap2tm1a/tm1a group, 34 for female Mrap2+/+ and 35 for Mrap2+/+ controls gender/genotype. P-values presented on graphs are either global P-values for genotype adjusted for multiple correction testing, or (in the cases of sexual dimorphism) the P-value is the impact of genotype for that sex. ***P=0.0005; NS, not significant.

 This work is licensed under a