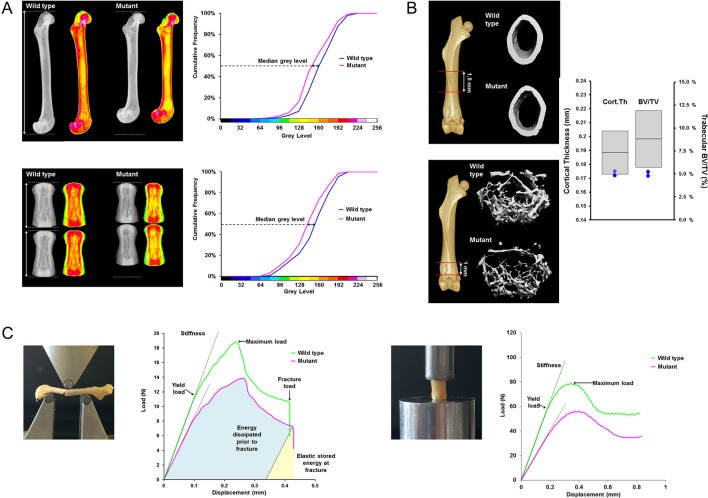
Figure 4.
OBCD skeletal phenotyping methods. (A) X-ray microradiography images of femur and fifth to sixth tail vertebrae from wild-type and mutant mice. Low bone mineral content is represented in green/yellow colour and high bone mineral content is represented in red/pink colour in pseudo-coloured images. Cumulative frequency graphs showing difference in bone mineral content between wild-type and mutant mice. (B) Micro-CT images of cortical and trabecular bone from wild-type and mutant mice. Cortical thickness and trabecular bone volume/total volume (BV/TV) parameters in the mutant are shown in comparison with reference mean ± 2 standard deviations. (C) Femur three-point bend and vertebral compression analysis with load–displacement curves illustrating biomechanical parameters.

 This work is licensed under a