
Figure 4.
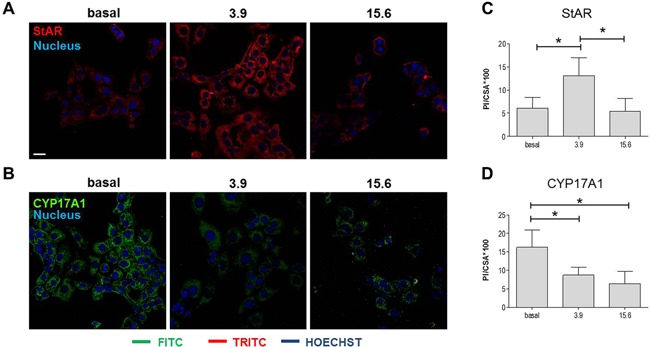
Effect of nandrolone supplementation on StAR and CYP17A1 levels: confocal analyses. (A and B) Representative microphotographs of immunofluorescence stain for StAR (A) and CYP17A1 (B) in cells treated with 3.9 and 15.6 μM of nandrolone. Basal: untreated cells. Bar = 25 μm. (C and D) Representative histograms of the immunofluorescence quantification of the staining intensity for StAR (C) and CYP17A1 (D). The stain intensity was expressed as the mean pixel intensity (PI) normalized to the cross‐sectional area (CSA) using the Leica application suite advanced fluorescence software. Vertical axis: PI/CSA *100. Horizontal axis: nandrolone concentration, in µM. Data are presented as the mean ± SD of quadruplicate experiments. * = P < 0.001.