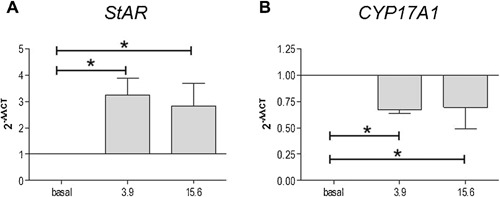
Figure 5.

Effect of nandrolone on StAR and CYP17A1 gene expression. qRT‐PCR evaluation of StAR and CYP17A1 gene expression after nandrolone stimulation at 3.9 and 15.6 µM. The graphs show the normalization with the reference genes, according to the Livak Method (2‐ΔΔCT). Vertical axis: 2‐ΔΔCT. Horizontal axis: nandrolone concentration, in µM. Basal: untreated cells. Data are presented as the mean ± SD of triplicate experiments. * = P < 0.05.
