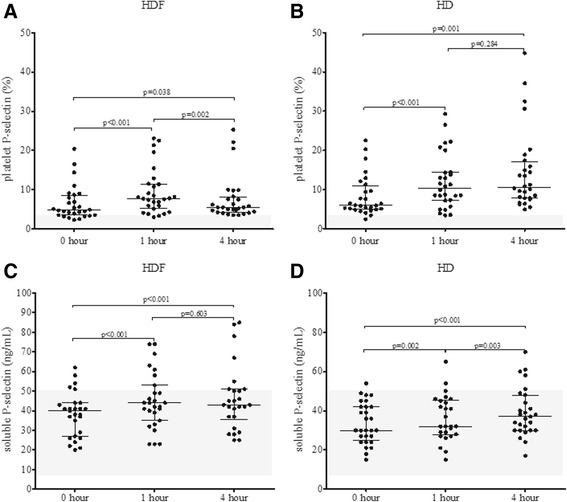
Fig. 1.

Changes in platelet P-selectin (a and b) and soluble P-selectin (c and d) during haemodiafiltration (HDF) and haemodialysis (HD) at 0, 1 and 4 h. The shaded area represents the reference range for the respective parameter on this and subsequent figures. P values were calculated by Wilcoxon signed ranks test
