Fig. 2.

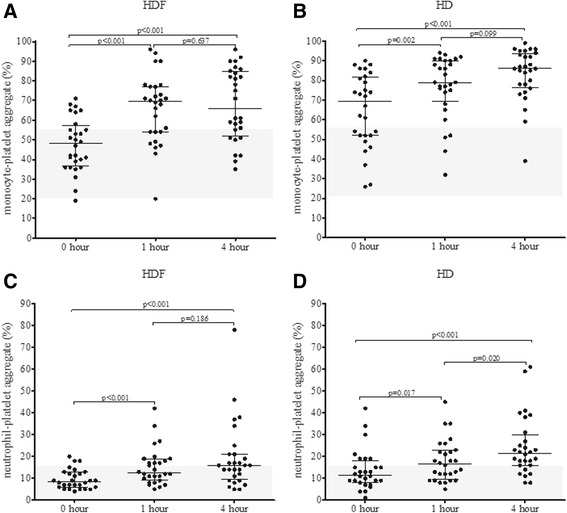
Changes in monocyte-platelet aggregates (a and b) and neutrophil-platelet aggregates (c and d) during haemodiafiltration (HDF) and haemodialysis (HD) at 0, 1 and 4 h. Wilcoxon signed ranks test was employed to calculate p values

Changes in monocyte-platelet aggregates (a and b) and neutrophil-platelet aggregates (c and d) during haemodiafiltration (HDF) and haemodialysis (HD) at 0, 1 and 4 h. Wilcoxon signed ranks test was employed to calculate p values