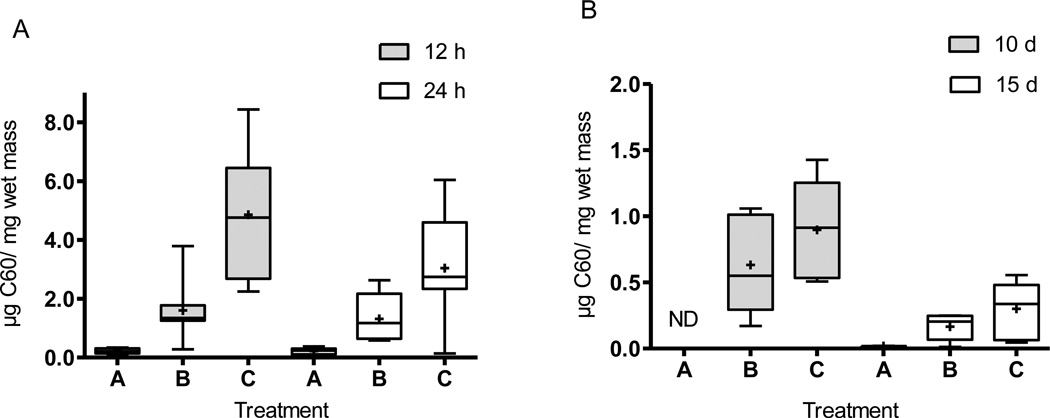
Fig. 1.
Box plots of the results for larval larvae body burdens after (A) acute (n = 6 in treatment A for both time points; for treatments B, C, n = 7 for both time points) and (B) chronic exposures (treatments B, C n = 5 after 10 d; and B and C n = 5 and 6 after 15 d, respectively while n=2 for treatment A after 15 d) to different treatments of C60. The symbol “+” indicates mean values, and whiskers indicate minimum and maximum values and bars indicates quartile ranges. Asterisks indicate significant differences from controls. ND = not detectable.

