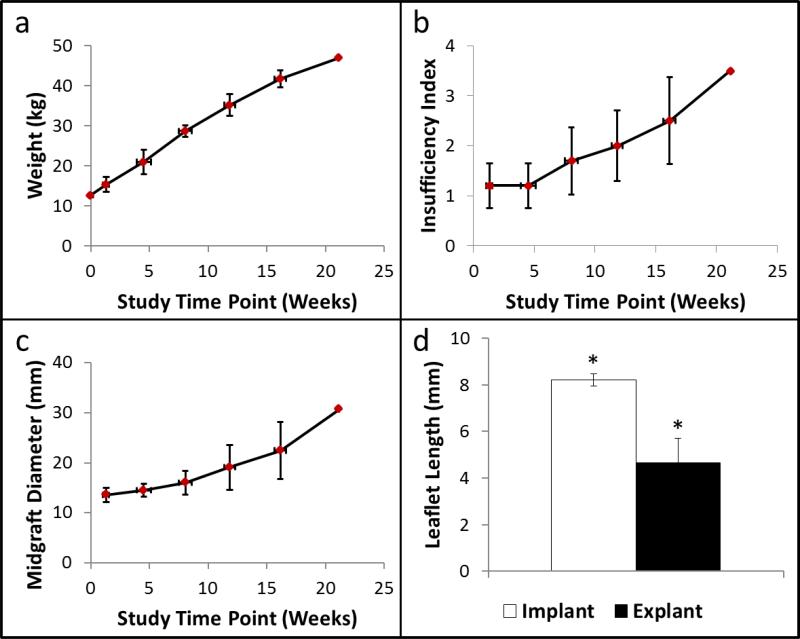
Figure 3.
(a) Animal weight, (b) valve insufficiency index, and (c) valve diameter midgraft as a function of study time point. (d) Leaflet length before and after implantation. N=5 for all panels. Paired symbols indicate a p-value < 0.05. Error bars in the x- and y-directions represent the standard deviation in the study time point and the measured values, respectively.

