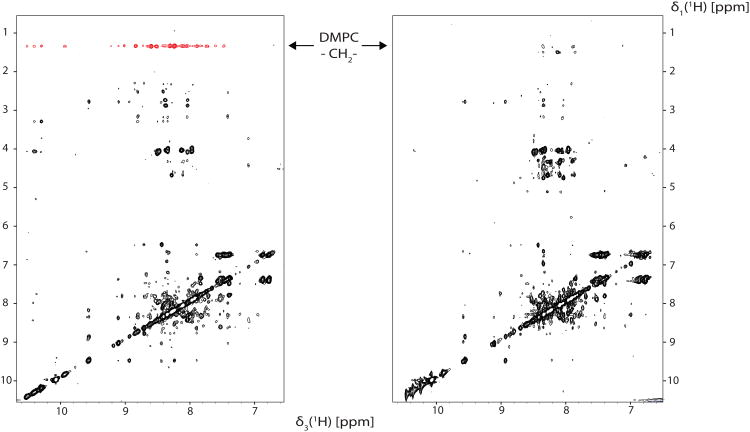
Figure 4.
Projections along the 15N dimensions of 3D NOESY-[15N,1H]-TROSY spectra (950 MHz) of 2H/15N-labeled LspA at diC7PC-DMPC ratios of 1.2. Samples employed for recording the spectra were prepared with protonated DMPC/d26-diC7PC (left) and d54-DMPC/protonated diC7PC (right). Indicated in red are the NOEs to the DMPC fatty acid methylene at 1.25ppm which are noticeably absent on the right. DMPC NOEs in the left spectrum are missing for certain residues (around 9.5ppm for V40, N47 and N53) due to their location in the β-sheets which are not embedded within the lipid bilayer. Peaks appearing in the spectrum on the right hand side are due to incomplete deuteration of that sample.

