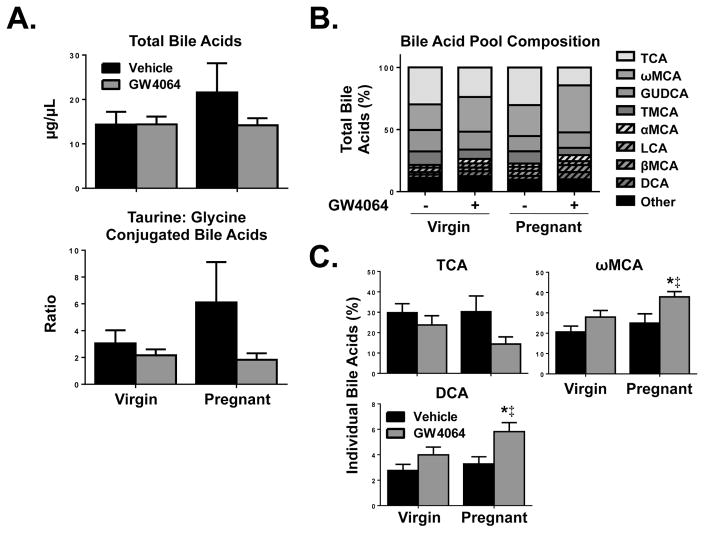
Fig. 5.
Plasma bile acid profiling of virgin and pregnant mice after short-term treatment with GW4064. (A) Total and (B, C) individual bile acids were determined in vehicle- and GW4064-treated virgin and pregnant mice on gestation day 14. Individual bile acids are shown as a percentage of total bile acids per group. Data are presented as mean relative expression ± SE (n=5). Black bars represent vehicle-treated mice and grey bars represent GW4064-treated mice. Asterisks (*) represent statistically significant difference (p≤0.05) compared with vehicle-treated virgin mice. Double daggers (‡) represent statistically significant difference (p≤0.05) compared with vehicle-treated pregnant mice.

