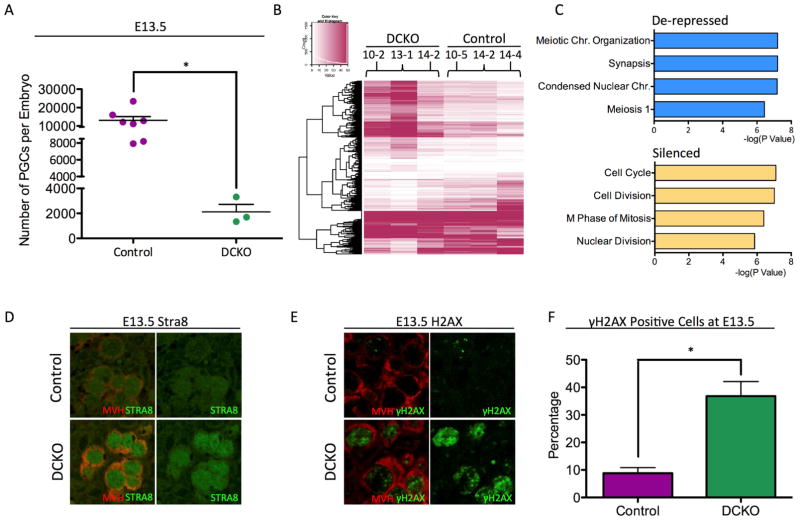
Figure 2. Dnmt1 conditional knockout female PGCs precociously turn on the meiotic program at E13.5.
(A) Total number of Control and DCKO female PGCs sorted at E13.5. Error bars, ± SEM; p=0.0092, two-tailed unpaired t test; n =10 biological replicates. (B) Heat map showing differentially expressed genes (DEGs) between DCKO and control PGCs (C) Gene ontology analysis of de-repressed and silenced genes in E13.5 DCKO female PGCs using DAVID Bioinformatics Resources 6.7. (D) Immunofluorescence of Control and DCKO E13.5 female gonads for MVH (red), and STRA8 (green) (n=3). (E) Immunofluorescence of Control and DCKO E13.5 female gonads for MVH (red), and gamma H2aX (green) (n=3). (F) Quantification of γH2AX foci in Control and DCKO PGCs (MVH) at E13.5. Error bars, ± SEM; p=0.0079, two-tailed Unpaired t test; n =3 biological replicates. FPKM stands for Fragments Per Kilobase of transcript per Million mapped reads. See also Figure S2, and Table S3

