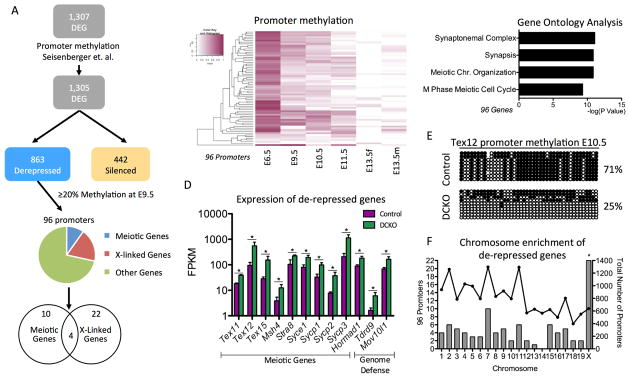
Figure 3. Meiotic genes regulated by DNMT1 have promoter methylation at E9.5.
(A) Analysis pipeline of DEGs in female PGCs at E13.5 to determine whether any de-repressed genes had promoter methylation of ≥ 20% in wild-type E9.5 PGCs (B) Heat map showing promoter methylation of the 96 DEG at E13.5 with promoter methylation of ≥ 20% at E9.5. (C) Gene ontology analysis of the 96 genes de-repressed genes with promoter methylation ≥ 20% at E9.5. (D) Examples of de-repressed genes at E13.5 with promoter methylation of ≥ 20% at E9.5. The genes with ≥ 2-fold difference in expression and FDR < 5% were considered differentially expressed. (E) Bisulfite PCR of the Tex12 promoter comparing Control and DCKO PGCs at E10.5 (F). Hypergeometric test to determine the significance of the number of methylated promoters per chromosome. Left axis: Number of de-repressed genes in the chromosome with promoter methylation of ≥ 20% at E9.5 (Bars). Right axis: Number of genes in the chromosome with E9.5 promoter methylation available (Lines). Hypergeometric test to evaluate the enrichment of the methylated and de-repressed genes in each chromosome. * Refers to statistical significance of hypergeometric test. FPKM stands for Fragments Per Kilobase of transcript per Million mapped reads. See also Table S1.

