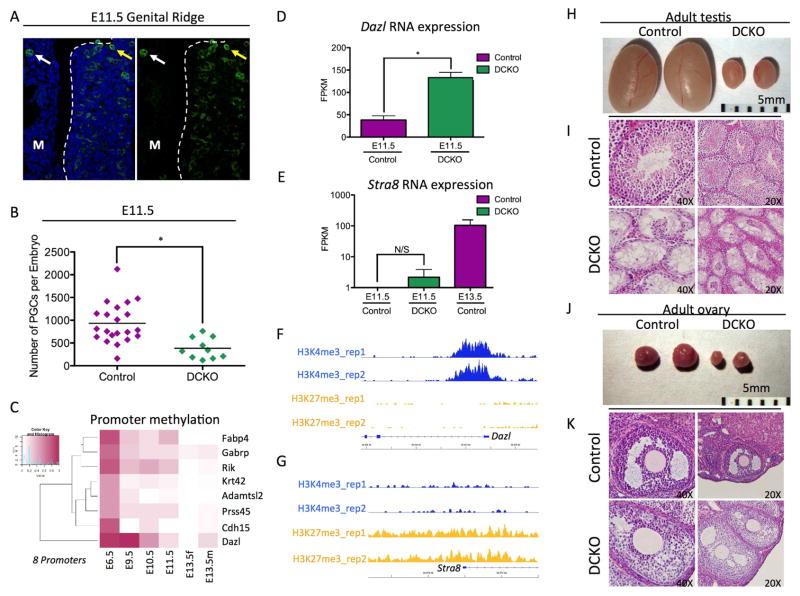
Figure 5. Dazl is de-repressed at E11.5 in mutant PGCs.
(A) Immunofluorescence of an E11.5 Genital ridge for SSEA1+ PGCs (green) and DAPI (blue). M refers to the mesonephros. White arrows point to a PGC in the mesonephors, the yellow arrows point to a PGCs that has colonized the genital ridge. (B) Total number of germ cells sorted at E11.5. Error bars, ± SEM; p=0.0009, two-tailed Unpaired t test; n =31 biological replicates. (C) Heat map showing promoter methylation of 8 DEG at E11.5 with promoter methylation of ≥ 20% at E9.5. (D) Dazl expression levels in E11.5 Control and DCKO PGCs. Genes with ≥ 2-fold difference in expression and FDR < 10% were considered differentially expressed. (E) Stra8 expression levels in E11.5 Control and DCKO PGCs. E13.5 PGCs are included as a control. Genes with ≥ 2-fold difference in expression and FDR < 10% were considered differentially expressed. (F, G) H3K27me3 and H3K4me3 peaks at the Dazl locus (F) and Stra8 locus (G) at E11.5. (H) Control (left) and DCKO (right) testes from 6 month male mice (n=1). (I) Histology of Adult testis comparing control (top) and DCKO (bottom) (n=1). (J) Control (left) and DCKO (right) ovaries from 6 month female mice (n=1) (K) Histology of adult ovary comparing control (top) and DCKO (bottom) (n=1). See also Table S5.

