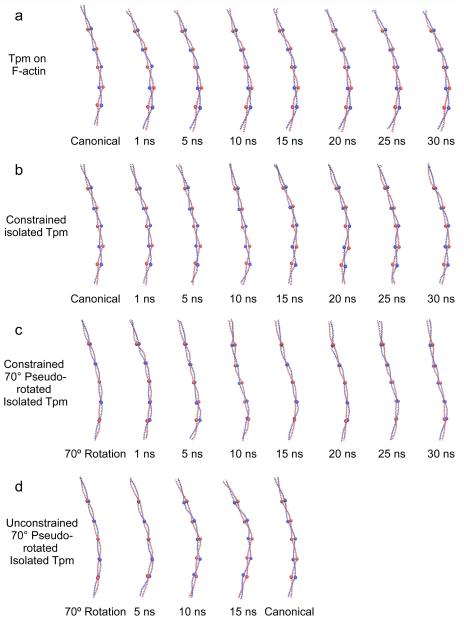
Figure 2.
Twisting of tropomyosin during molecular dynamics simulations. Snapshots of tropomyosin coiled-coils sampled during MD, shown with the C-terminal end facing up. In the case where tropomyosin motions were associated with F-actin, only tropomyosin is shown for comparison but the underlying F-actin is not shown. In each case shown, ribbon diagrams of tropomyosin of one representative structure during the indicated time of simulation is displayed. The structure chosen had the lowest root mean square deviation of backbone atoms to the calculated average structure for the indicated time period. To visualize the changes in orientation of tropomyosin, residues 48, 90, 139, 184, and 233 have been highlighted with large spheres. Note, that in the canonical structure, the spheres lie in the plane of the page, while in the 70°rotation the spheres lie on top of one another. Also note, the twisting during MD that characterizes the tropomyosin ends, particularly at the C-terminal region, and the general lack of substantial twisting in the central domains. While localized twisting can be observed during the simulations, no concerted rotations of the entire tropomyosin chain are seen with the exception of those in panel (d), where a concerted rotation from 70°back to the canonical structure occurs.

