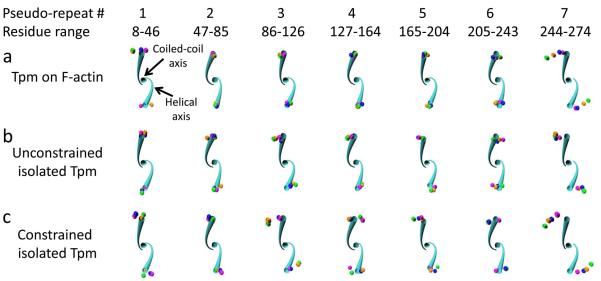
Figure 3.
Twisting by pseudo-repeat. Twisting deviation is shown for each tropomyosin pseudo-repeat over time (colored spheres) relative to the canonical tropomyosin structure (cyan tube). The helical axes and coiled-coil axis are displayed for the canonical structure (cyan) for the indicated residue ranges. The view is oriented down the coiled-coil axis looking toward the N-terminus, so that the canonical left-handed rotation proceeds in a clockwise fashion. The pseudo-repeats of each representative structure from the indicated simulations in each panel were aligned to the canonical structure by superposition of four coordinates in the residue range: the two N-terminal helical axes coordinates and the N- and C-terminal coiled-coil axis coordinates. Spheres at the location of the C-terminal residue helical axes for 1 ns (magenta), 10 ns (orange), 20 ns (green), and 30 ns (blue) of the representative structures are shown, displaying the cumulative twist difference over the residue range. Note that pseudo-repeat 7 shows a pronounced counter-clockwise (untwisting) deviation of the representative structure compared to the canonical structure (i.e. the spheres are furthest from the cyan tube), whereas the other pseudo-repeats show little change in twist. All axes positions were calculated with TWISTER.

