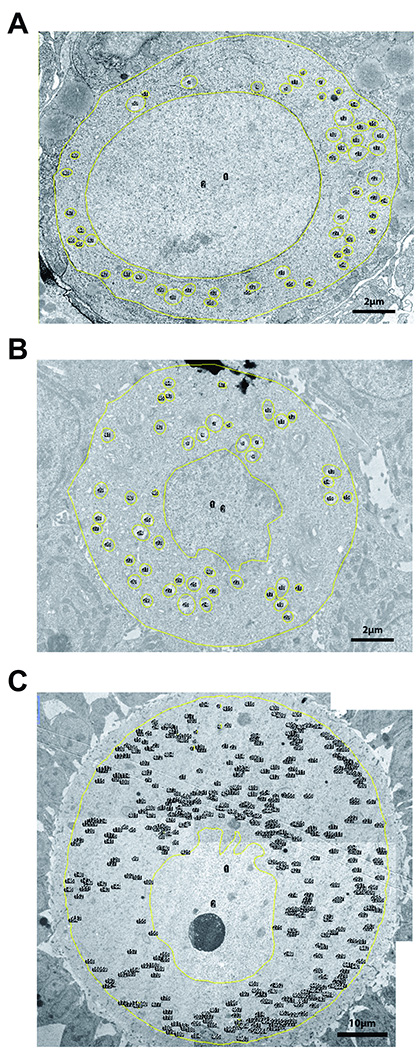
Figure 1. Representative images of mouse ovarian follicles used for electron microscopic studies.
A) primordial B) primary C) early antral follicle. Yellow lines outline cell membrane, nucleus and mitochondria. Cytosol area is calculated by subtracting nucleus area from whole cell area. Mitochondria density is calculated by dividing the total number of mitochondria to cytosol area. Mitochondria coverage is calculated by dividing total mitochondria area to cytosol area. Mitochondrion area (average mitochondrion size) is calculated by dividing the total mitochondria area to total mitochondria number. Mitochondrion aspect ratio is calculated by dividing major mitochondrion axis by minor mitochondrion axis (minimal value is 1.0). For larger follicles (C) several photos of the follicle were taken to cover the entire oocyte area at desired resolution to be able to visualize mitochondria. These photographs were then montaged into a single image before analysis.

