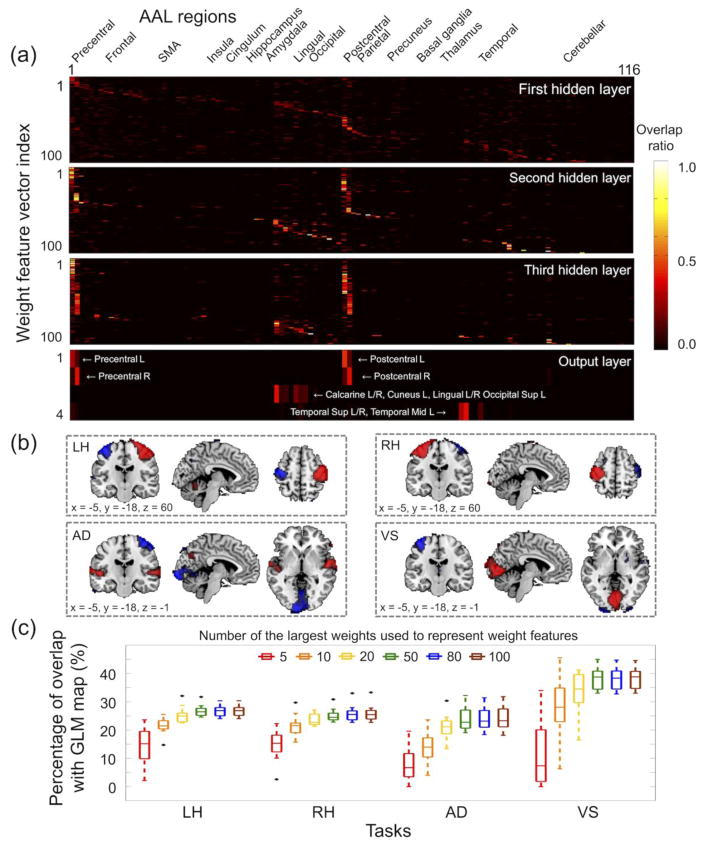
Figure 6.
Interpretation of weight parameters learned from the three-layer DNN with the percentage of non-zero weights of 0.2, 0.2, and 0.2 in the first, second, and third layers, respectively. (a) Overlap ratios between each of the weight feature vectors in each layer and each of the 116 AAL regions (see the labels of the 116 AAL regions at http://neuro.imm.dtu.dk/wiki/Automated_Anatomical_Labeling). (b) Four weight-feature vectors in the output layer were pseudo z-scored to have a zero-mean and unit-variance for visualization (absolute z-score > 3.29 or p < 0.001; positive values in red and negative values in blue). (c) Box-whisker plots illustrate the overlap ratios between the weight-feature vector representations in the output layer and the group inference of the GLM activation maps for each task (uncorrected p < 0.001). Weight-feature vector representations in the output layer were calculated for varying numbers of large values from the weight vector representation in each of the hidden layers using Eqs. (1) and (2). AAL, automated anatomical labeling; Sup, superior; Mid, middle.

