
Figure 3.
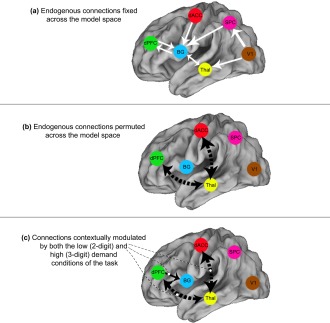
Model space and connections of interest. The figure provides an illustration of the employed model space. (a) White arrows represent endogenous connections that were fixed across the model space. (b) Black arrows represent endogenous connections that were permuted across the model space. (c) These connections were contextually modulated by both the low (2‐digit) and high (3‐digit) demand conditions. Broken black arrows (ascending and descending dPFC ↔ thalamus and dACC ↔ thalamus connections) were permuted for endogenous connectivity AND contextual modulation, whereas the solid black arrow (dPFC → BG connection) was fixed, and was also modulated by task. [Color figure can be viewed in the online issue, which is available at http://wileyonlinelibrary.com.]