
Table 2.
Table depicts statistical information (t scores) associated with estimates of significant contextual modulation (i.e., different than zero) during the (a) “low” (2‐digit; left) and (b) “high” (3‐digit; right) demand condition
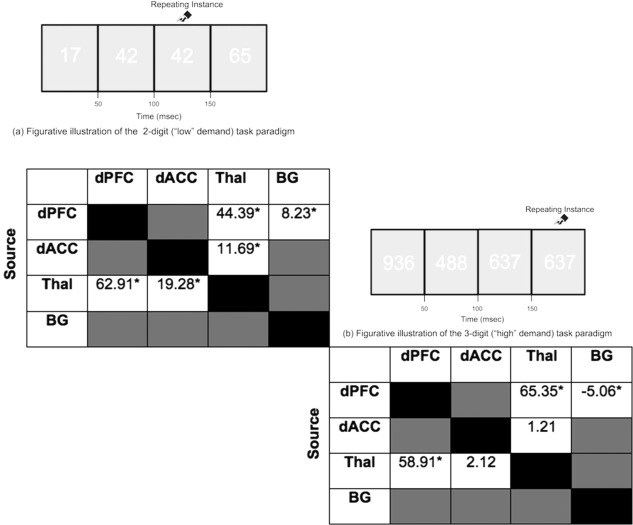
|
Source regions for each pathway are listed by row; targets are listed by column. Significant differences (p < 0.05, Bonferroni) are denoted*