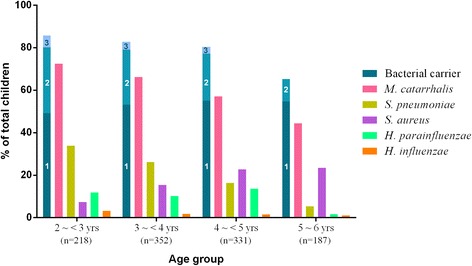
Fig. 1.

Bacterial carriage in healthy kindergarten children by age group (n = 1,088). The cardinal numbers in the first column indicate the no. of bacterial species carried by individual children. Carriage of 4 bacterial species accounted for 0.7 % and 0.8 % of children in the 3 ~ <4 years- and 4 ~ <5 years-age groups, respectively (not shown in figure)
