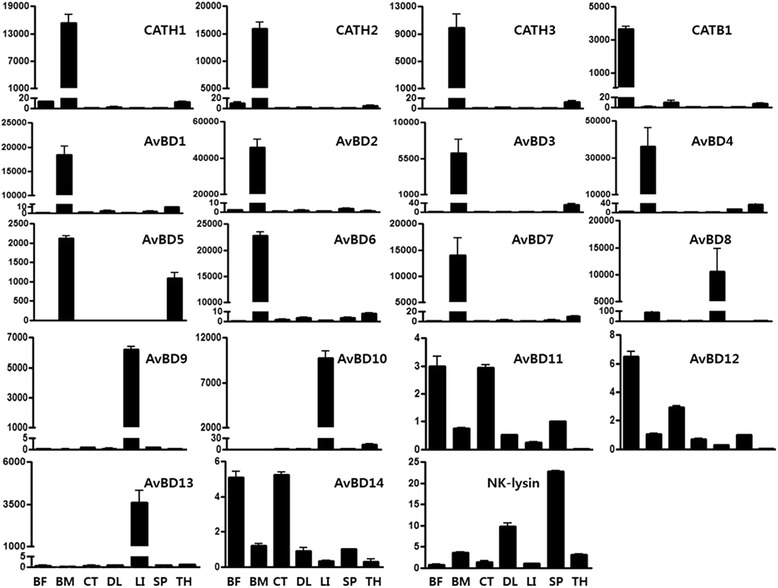
Fig. 1.

Tissue expression of chicken HDPs. Quantitative RT-PCR analysis of CATH, AvBD and NK-lysin gene expression in chicken tissues. The relative abundance of mRNA was assessed by normalization and calibrated to glyceraldehyde 3-phosphate dehydrogenase (GAPDH). BF Bursa of Fabricius, BM bone marrow, CT cecal tonsil, DL duodenal loop, LI liver, SP spleen and TH thymus
