
Fig. 2.
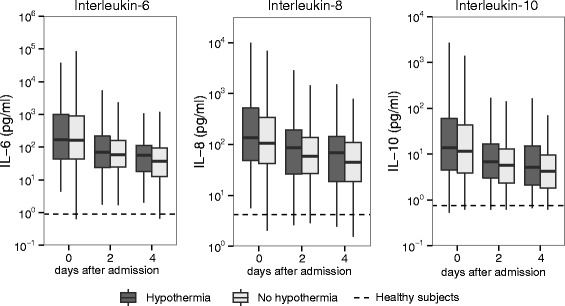
Plasma cytokine levels in patients with sepsis, stratified according to the presence of hypothermia. Box and whisker diagrams depict the median and lower quartile, upper quartile and respective 1.5 IQR as whiskers. Dashed lines represent median levels in healthy volunteers. Differences between patient groups were not significant