Fig. 6.

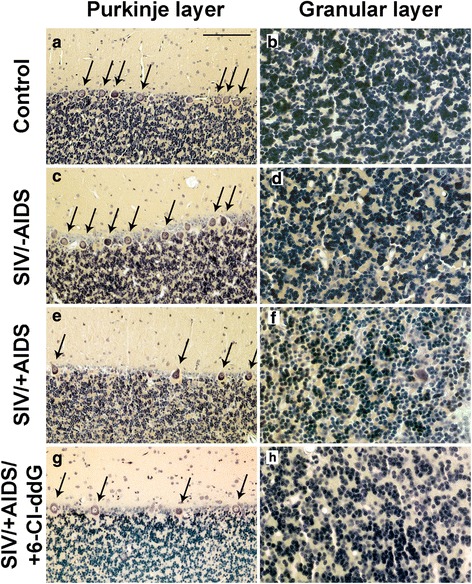
Neurodegeneration. Representative slices of Purkinje layer (a, c, e, g) and granular layer (b, d, f, h) with Giemsa staining. Arrows indicate Purkinje cell bodies. Scale bar (in a) 100 μm in a, c, e, g; 50 μm in b, d, f, h

Neurodegeneration. Representative slices of Purkinje layer (a, c, e, g) and granular layer (b, d, f, h) with Giemsa staining. Arrows indicate Purkinje cell bodies. Scale bar (in a) 100 μm in a, c, e, g; 50 μm in b, d, f, h