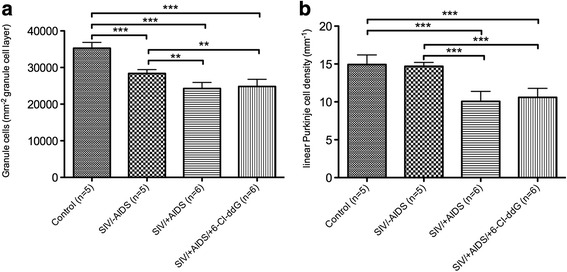
Fig. 7.

Quantification of neuronal loss. a Significant reduction of granule cells (GC) in the SIV/-AIDS group (28,387 ± 1042/mm2) and extension in the SIV/+AIDS group (849.9 ± 57.5/0.035 mm2) compared to the control group (35,269 ± 1584/mm2). 6-Cl-ddG stops the loss of granule cells, but as expected cannot reverse it (24,821 ± 1966/mm2). b Significant decrease in the linear Purkinje cell density (LPD) in the SIV/+AIDS group (10.07 ± 1.31/mm) compared to the control group (14.93 ± 1.27/mm) and the SIV/-AIDS group (14.69 ± 0.52/mm). 6-Cl-ddG stops, but as expected cannot reverse the reduction in the LPD (10.06 ± 1.19/mm). Illustration of mean value (MV) and standard deviation (SD) (MV ± SD)
