
Fig. 1.
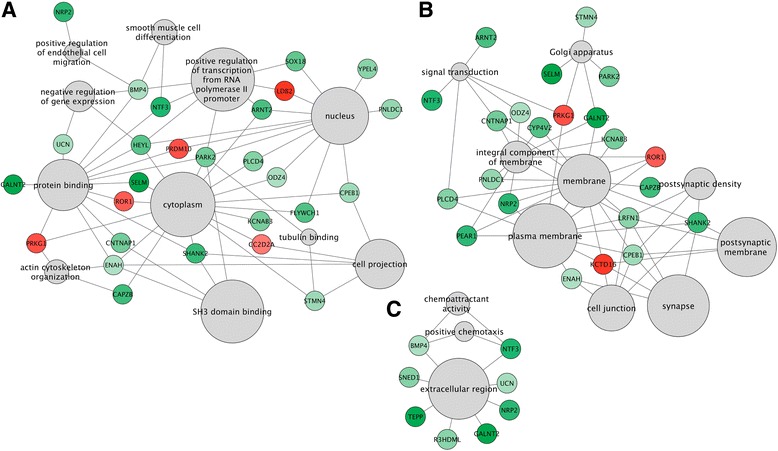
Gene ontology enrichment map based on top differentially methylated genes in MMC patients. The map displays three clusters of functionally related gene-sets in MMC patients versus controls (a–c). Gray nodes represent GO classes and the size of each node is correlated with its significance (adjusted P value). Green and red nodes represent hypomethylated and hypermethylated genes, respectively. The intensity of the color is correlated with β difference