
Fig. 5.
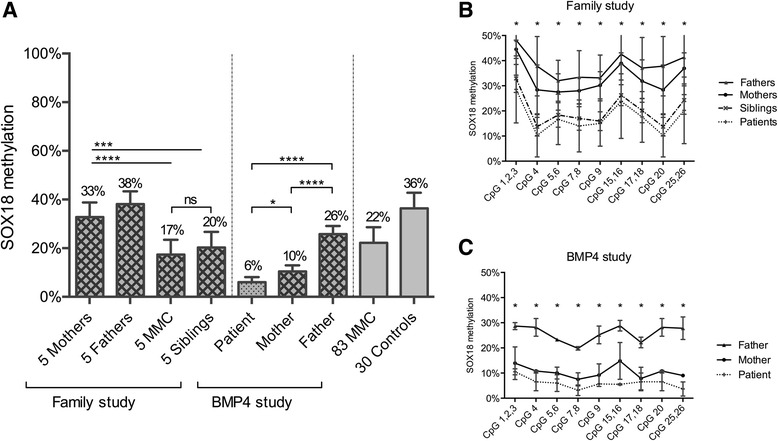
SOX18 methylation for the family study and the BMP4 study by Sequenom EpiTYPER. a Mean methylation and standard deviation of SOX18 methylation for the family study and the BMP4 study. The mean methylation level of each group is shown above the plot. *P value <0.05, **P value <0.01, ***P value <0.001, ****P value <0.0001. b Methylation pattern for each CpG unit within the SOX18 amplicon for the family study. Multiple t test was performed for each CpG. *P value <0.05. c Methylation pattern for each CpG unit within the SOX18 amplicon for the BMP4 study. Multiple t test was performed for each CpG. *P value <0.05. The family study consists of MMC patients, their unaffected siblings, and their parents (n = 5 for each group). The BMP4 study describes the family of a patient with a BMP4 deletion. The father is carrier of the BMP4 deletion