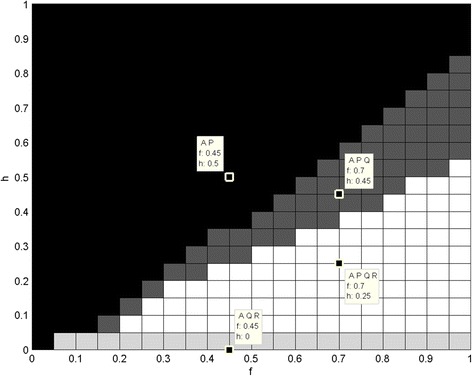
Fig. 2.

Different subpopulations in accordance to changing parameters. Different subpopulations (represented by shades of grey) in accordance to changing parameters: changing h and f with constant i = 0.3, j = 0.4, e = 0.3, g = 0.4. Some sample points with concrete h and f values and resulting subpopulation are shown
