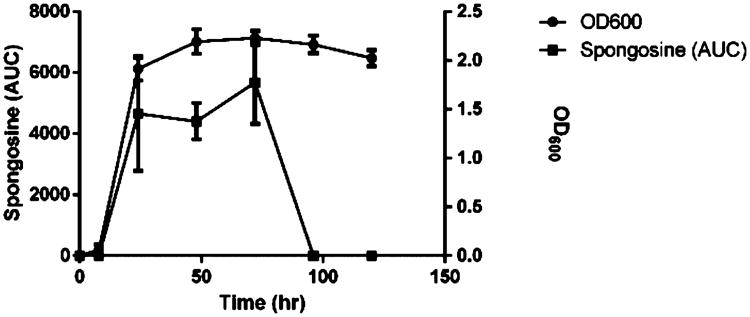
Figure 4.
Time course of spongosine production. Growth and relative spongosine production of Vibrio harveyi plotted versus time (n = 3). Relative production of spongosine was calculated as the area under the curve (AUC) of the extracted spongosine ion (m/z 298). Vidarabine (Ara A) was used as an internal standard.

