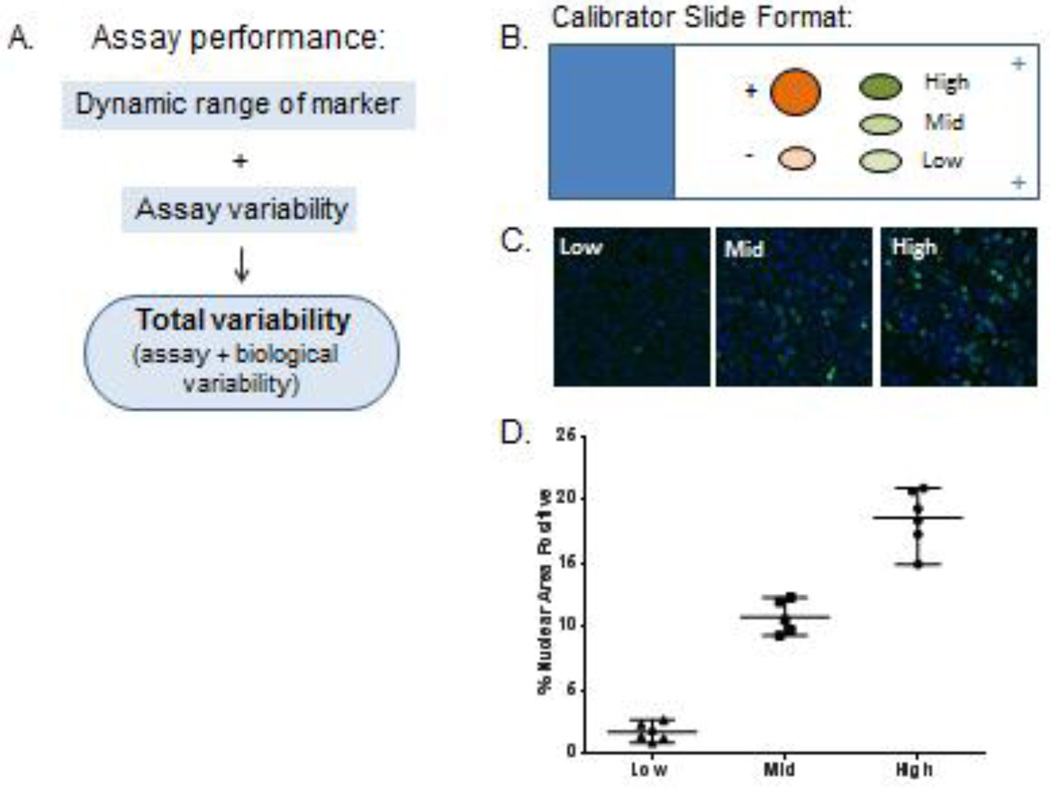
Figure 4. Establishment of assay performance and variability.
(A) Factors that influence assay performance. (B) Diagram of typical calibrator slide layout for an assay measuring a single marker. Positive and negative control tissue are designated “+” and “−”, respectively. Low, mid and high range calibrator tissue depicted with ovals. (C) Representative images of calibrator tissue for a nuclear marker. (D) Representative plot of assay performance and variability of the calibrator material used to define the specifications. Mean and one standard deviation plotted for each calibrator along with individual values.

