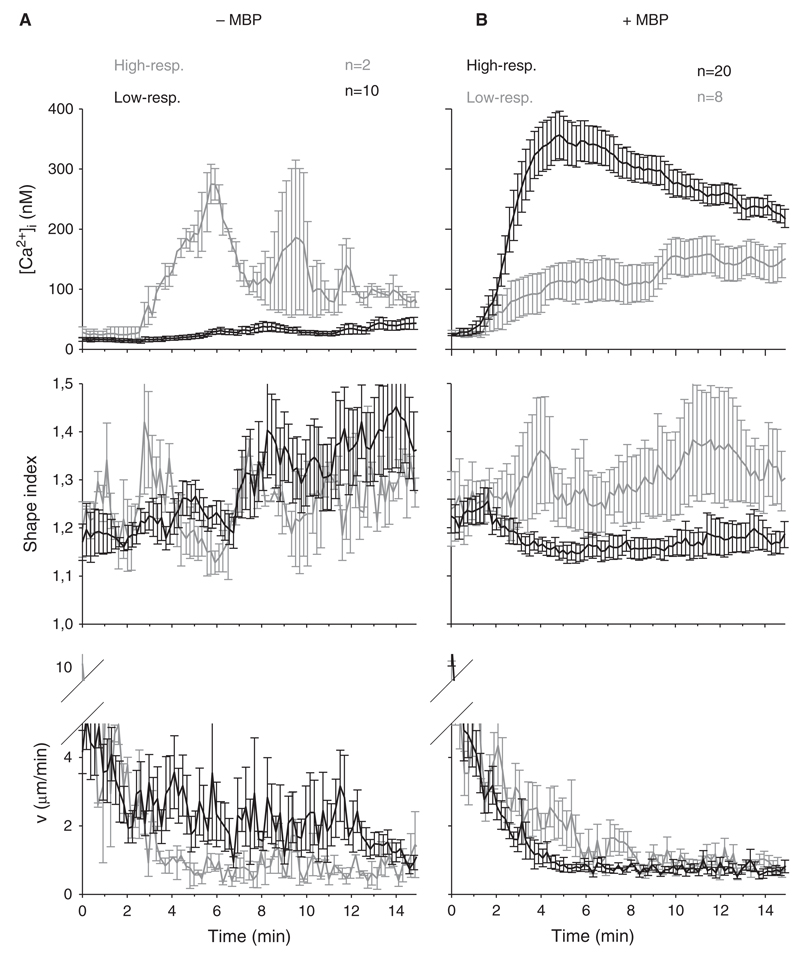
Figure 2.
Ca2+ signalling, shape and motility pattern of high- and low-responding TMBP cells. Mean [Ca2+]i, shape index and motility of TMBP cells after contact to MBP-pulsed (right) astrocytes are displayed (±SEM). Control T cells with non-pulsed astrocytes are shown on the left. Black lines correspond to the majority and grey lines to the minority of T cells at a certain condition (+/− MBP).

