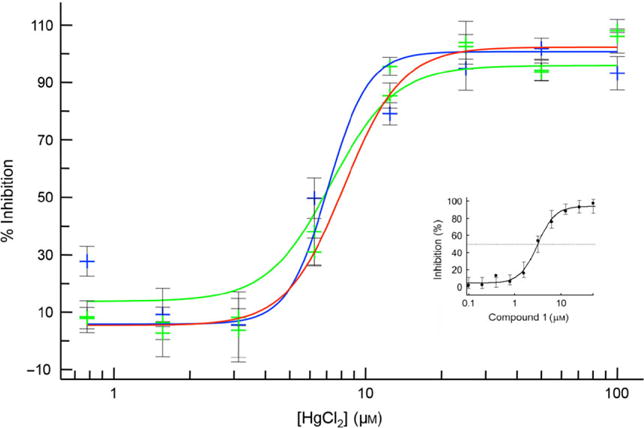
Figure 2.

Dose-dependent inhibition of AQP1-expressing CHO cells by HgCl2: The Vi, Vc, and Vo-values from fluorescence traces (Figure 1) were transformed to percentage inhibition as described in Methods and Materials and fitted to a 4-parameter function against the HgCl2 concentration. Shown are three curves representing fits against data points obtained from three separate experiments. (Inset): Dose-dependent inhibition by compound 1 (see text).
