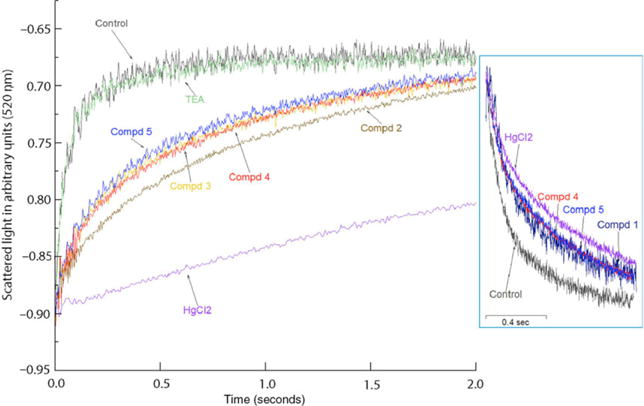
Figure 6.

Characterization of AQP1 inhibitors using vesicular assay. The plots represent swelling of NLS-treated AQP1-enriched erythrocyte ghosts under hypo-osmotic shock. Control is ghost only, without any compound. Inset shows a shrinkage assay for purified AQP1 reconstituted proteoliposomes exposed to hyper-osmotic shock. Control is AQP1 proteoliposome only, without any compound. In both sets of experiments, the compounds were at final concentration of 75 μM while HgCl2 was at a concentration of 50 μM.
