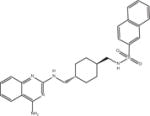
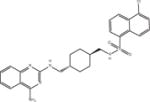
Table 1.
AQP1 inhibitors (IC50 and structures)
| Compound | Structure | Class | IC50 μM |
|---|---|---|---|
| Compound 1 |

|
ASQ | 2.7 ± 0.6 (n = 10) |
| Compound 2 |

|
ASQ | 3.9 ± 0.4 (n = 6) |
| Compound 3 |

|
ASQ | 5.8 ± 0.5 (n = 6) |
| Compound 4 |

|
DHBF | 9.8 ± 0.7 (n = 10) |
| Compound 5 |

|
DHBF | 15.2 ± 1.1 (n = 3) |
| Compound 6 |

|
DHBF | 29.4 ± 0.8 (n = 3) |
