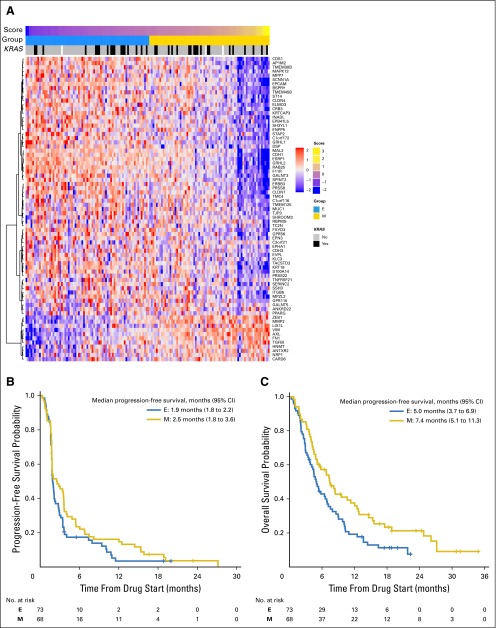
Fig 4.
(A) The epithelial mesenchymal transition gene expression signature classifies BATTLE-2 tumors (all treatment arms) into epithelial (E) and mesenchymal (M). Distribution of KRAS-mutated tumors is shown. (B) Progression-free survival among epithelial and mesenchymal tumors (log-rank test P = .12). (C) Overall survival was superior for patients with mesenchymal tumors (log-rank test P = .02).

