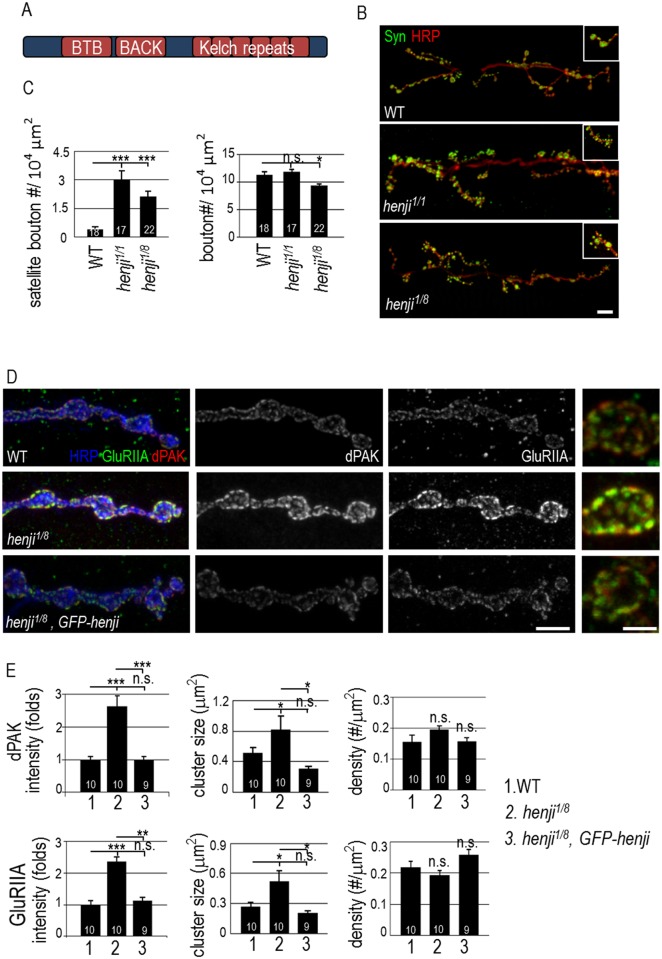
Fig 1. NMJ morphology and dPAK and GluR levels are altered in henji mutants.
Schematic diagram shows the conserved BTB, BACK and Kelch repeats domains of Henji. (B) Immunostaining of third-instar larval NMJs of w1118 (WT), henji1/henji1 (henji1/1) and henji1/henji8 (henji1/8) with anti-HRP and anti-Synapsin (Syn) antibodies to reveal the overall NMJ morphology. Insets show enlarged images of normal and satellite boutons in each panel. Scale bar represents 20 μm. (C) Bar graphs show mean numbers (± SEM) for satellite boutons normalized to muscle areas (WT, 0.40 ± 0.13; henji1/1, 3.00 ± 0.48; henji1/8, 2.13 ± 0.29; per 104 μm2), and for regular boutons normalized to muscle areas (WT, 11.30 ± 0.62; henji1, 11.86 ± 0.44; henji1/8, 9.35 ± 0.38; per 104 μm2). (D) Immunostaining for HRP, dPAK and GluRIIA to show NMJs of WT, henji1/8, and henji1/8 GFP-henji. Enlarged images for single boutons are on the right side. Scale bars are 10 μm (left) and 5 μm (right), respectively. (E) Bar graphs show means (± SEM) for dPAK fluorescence intensity normalized to HRP intensity (WT, 1.00 ± 0.09; henji1/8, 2.54 ± 0.32; henji1/8,GFP-henji, 1.03 ± 0.09), dPAK cluster size (WT, 0.49 ± 0.09; henji1/8, 0.94 ± 0.20; henji1/8,GFP-henji, 0.31 ± 0.03 μm2), dPAK punctum density normalized to HRP area (WT, 0.16 ± 0.02; henji1/8, 0.20 ± 0.01; henji1/8,GFP-henji, 0.16 ± 0.01; # per μm2), GluRIIA fluorescence intensity normalized to HRP intensity (WT, 1.00 ± 0.14; henji1/8, 2.18 ± 0.15; henji1/8,GFP-henji, 1.28 ± 0.13), GluRIIA punctum size (WT, 0.29 ± 0.05; henji1/8, 0.59 ± 0.11; henji1/8,GFP-henji, 0.20 ± 0.02 μm2) and GluRIIA punctum density normalized to HRP area (WT, 0.22 ± 0.02; henji1/8, 0.18 ± 0.01; henji1/8,GFP-henji, 0.26 ± 0.02; # per μm2). Both dPAK and GluRIIA fluorescence intensities normalized to HRP intensities are set as 1 in WT. Statistical significance by unpaired Student t-test is shown as *, p < 0.05; **, p < 0.01; ***, p < 0.001.

